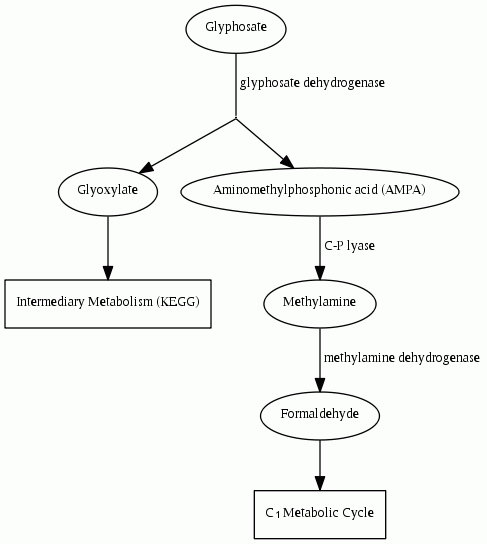

When viewing a dynamic pathway imap you will see an image similar to this:


The pathway above illustrates many of the features of the pathway map. Several shapes and names represent different aspects of the pathway; click on any name for more information. Ovals represent compounds in the pathway. Arrows represent reactions between compounds catalyzed by enzymes. The name of the catalyzing enzyme will be printed near the arrow. Rectangles represent ways to continue the current pathway map. These may be links to C1 metabolism (e.g. methanogenesis or the C1 cycle), or links to pathways for common Intermediary Metbolism found in the KEGG database.
Compound images and reaction graphics can be viewed by simply hovering the mouse over the compound Ovals or Arrow text in the pathway display.
Several controls are also provided to make viewing large pathways easier.
Zoom In will make the image larger so it's easier to see small details and Zoom Out will make the image smaller so
more information can be fit on one screen.
The Clear link will clear any zooming and return the pathway to its original size. The ? link will show these instructions.
The Print Pathway link provides an easy way to print just the pathway itself.
Large pathways may not fit on one page so the pathway may need to be zoomed out several times before printing.
Many browsers also have options to scale printed output to fit on one page.
© , EAWAG.